Send With Confidence
Partner with the email service trusted by developers and marketers for time-savings, scalability, and delivery expertise.
Time to read: 3 minutes

Welcome back to the final installment of Behind the Scoop, a four-part series that was created to peel back the layers of the email newsletter process and provide tips from SendGrid’s very own in-house email marketing team. I’ve been talking with our Email Engagement Manager, Jill Guest to gain her insight on how she plans, creates, and sends out SendGrid’s very own quarterly customer newsletter, The SendGrid Scoop.
Today we're covering what to do after you’ve pushed send. Measuring your engagement statistics, reviewing results of any A/B testing, and reporting/celebrating success affirms strategies or illuminates areas that you can improve on.
Once she sends out The Scoop, Jill is eager to check its engagement stats, but says she tries not to read too much into the numbers right away. She waits a full 72 hours so that the global audience has had the time to receive, open, or decide how they are going to interact with the content before pulling final engagement data.
Jill then uses the analytics capabilities within SendGrid Marketing Campaigns to report out on the newsletter performance. These metrics include:
 Jill sends an email with the above stats to her team as well as anyone one else who contributed to the issue. When writing your own recap emails, she recommends providing as much context as possible. One of the benefits of this stage in the newsletter cycle is that performance always generates a high level of internal interest, so don’t overlook sharing the success no matter how small you think it is. Your stakeholders will appreciate and start to look forward to a performance recap after each newsletter.
The interactive heat map, the newest metric Jill includes in her recap email, (see image to the left) displays which stories were clicked on most. She uses Google drawings to record link performance by measuring the percentage of all links clicked. The heat map helps her uncover fresh insights about what our recipients are most interested in and has given the team some new ideas for content to generate or email tests to run. This has been very popular for Jill and her team.
Besides building more historical data, each email newsletter you send provides you the opportunity to A/B test certain variables of your strategy. Jill recommends always running some sort of A/B or multivariate testing (both content and design) to glean additional insight when you are reviewing engagement stats. Some simple A/B testing you can perform include subject lines, image to text ratios, and call-to-actions (CTA variations).
Expect to be surprised after some A/B tests. As an email company, SendGrid has two distinct but different audiences: marketers and developers. Jill said when The Scoop first started, her team decided to test two completely separate versions of the newsletter; one geared towards the marketer and the other for the developer. Turns out, it didn’t resonate much more that way and average engagement actually went down.
“You never really know until you try,” says Jill. “Be open to the results and know that each test will give you a better picture of your newsletter program and where you can take it.”
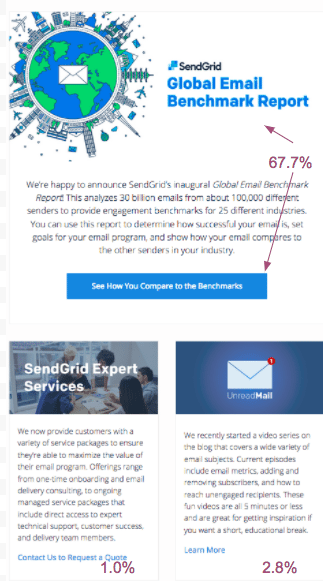
Do you have more questions about newsletters? Reach out to us on Twitter or Facebook and we’ll get back to you ASAP! And if you want to dive more into email engagement stats for your particular industry, check out SendGrid’s Global Email Benchmark Report.
Partner with the email service trusted by developers and marketers for time-savings, scalability, and delivery expertise.